One more go at the East Asia 1997 versus Euro Area 2008 comparison.
The back story is that East Asia underwent a severe crisis in 1997-98, which saw the collapse of its overvalued currency pegs. But, surprise surprise, this “devaluation devaluation” was followed by robust growth.
By contrast, the “internal devaluation” (ID) strategy is to achieve the same real-effective devaluation through the price level alone. This is what the likes of Spain, Italy etc must do if they choose to stay in the euro area.
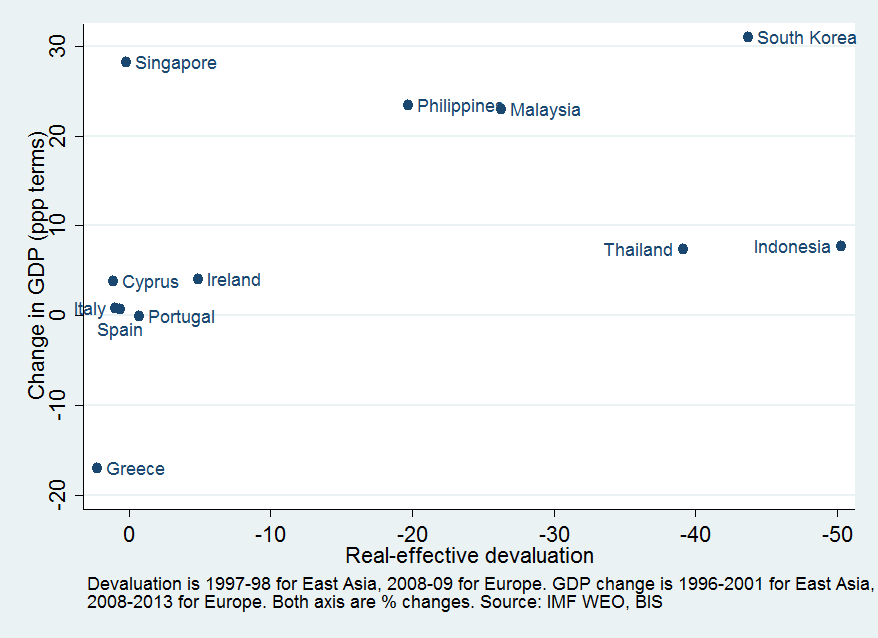
The scatter plot shows the real-effective devaluation in the initial year of crisis (x axis) versus the change in GDP (ppp terms) from pre-crisis to crisis+5 years.
Even the darling of the ID gang, Ireland, hasn’t fared as well as the least-successful Asia-6 economy.
Comments are closed.